Redistricting the Nation

We shed the light on redistricting and gerrymandering with reporting, analysis, open source tools, and consulting.

What does redistricting look like? Use the slider to see how the districts of three contentious states have changed over the years.

Pennsylvania in 1953
Pennsylvania in 1963
Pennsylvania in 1973
Pennsylvania in 1983
Pennsylvania in 1993
Pennsylvania in 2013
Pennsylvania in 2019
North Carolina in 1953
North Carolina in 1963
North Carolina in 1973
North Carolina in 1983
North Carolina in 1993
North Carolina in 2013
North Carolina in 2017
Arizona in 1953
Arizona in 1963
Arizona in 1973
Arizona in 1983
Arizona in 1993
Arizona in 2013
Learn

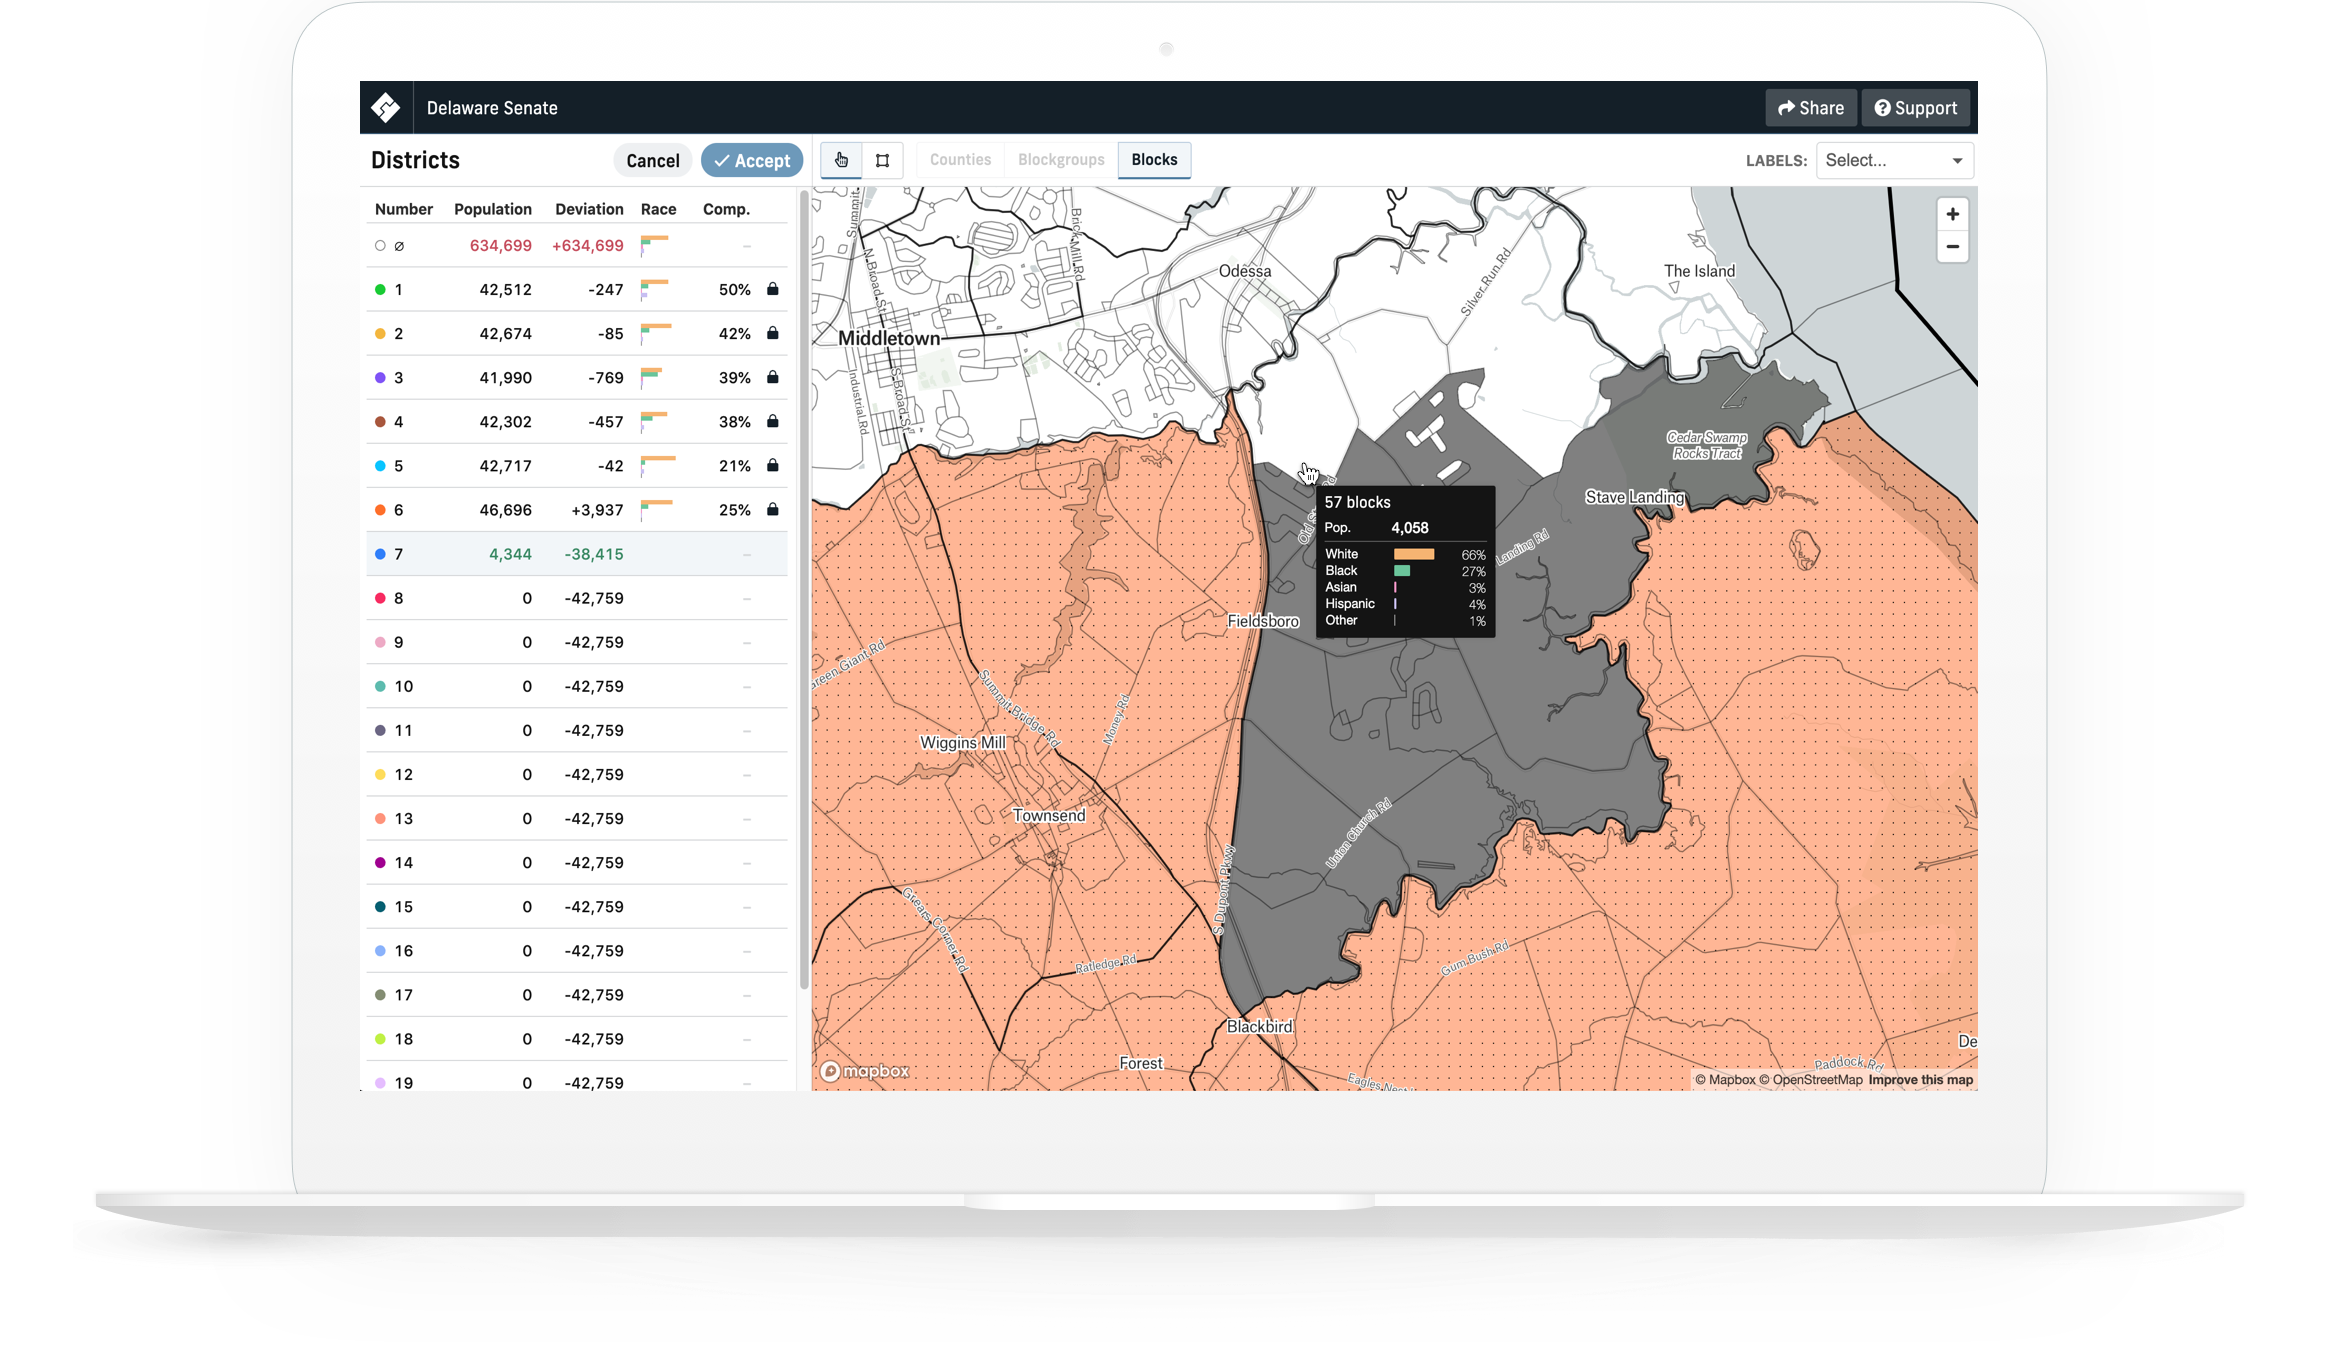
What is redistricting?

Redistricting is the process of adjusting districts based on population. It affects every type of district from which people represent us—from federal, to state and local districts.

In the U.S., this generally happens every ten years after the Census Bureau completes its decennial Census and the new population data is released to each state legislature. However, the U.S. Constitution has little to say about how redistricting should occur. Beyond the universal requirement for “one person, one vote”, each state is free to determine its own constitutional requirements or statutes for redistricting. For instance, states may have different standards for acceptable deviation from the equal population requirement, and information that is acceptable to use in one state’s process may be explicitly forbidden in another’s.

Want more in-depth information about gerrymandering?

Azavea has on-hand experts in redistricting and gerrymandering. Let us help you with research and analysis, expert witness testimony, and redistricting plans.

Contact us

How do we know if gerrymandering has occurred?

  1. Compactness metrics

    One of the “traditional” redistricting principles, low compactness is often a sign of potential gerrymandering by courts, state law and the academic literature.
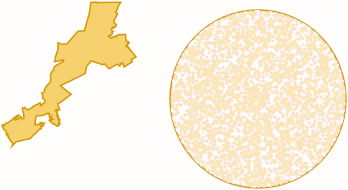
    District and a circle that is about the same height and width side-by-side.
    4 times pi divided by A over P super 2.
    Polsby-popper

    Ratio of the area of the district to the area of a circle whose circumference is equal to the perimeter of the district.

    District shown next to a circle that is noticeably smaller.
    1 divided by P over C.
    Schwartzberg

    Ratio of the perimeter of the district to the circumference of a circle whose area is equal to the area of the district.

    District contained on all sides by a polygon.
    A over the area of a minimum convex polygon.
    Area/Convex Hull

    Ratio of the area of the district to the area of the minimum convex polygon that can enclose the district’s geometry.

    A district contained in a circle.
    A over the area of a minimum bounding circle.
    Reock

    Ratio of the area of the district to the area of the minimum bounding circle enclose’s the district’s geometry.

  2. Efficiency Gap

    Measures a political party’s wasted votes to calculate a partisan advantage.

  3. Partisan Symmetry

    Ratio of districts a party wins to how many votes it wins in a legislative body.

  4. Sampling

    Measure of how much a redistricting plan deviates from normal.

Read

Writings on redistricting

As each round of Congressional redistricting took place, we set out to measure district compactness and gerrymandering to assess how the results have affected the geometry and geography of legislative districts across the US.

Blog

More on this topic

04/30/2020

What A Delay in the U.S. Census Means for Elections and Redistricting

by Daniel McGlone

Read post

02/27/2020

Local Redistricting is Transforming California Cities

by Luke McKinstry

Read post

01/23/2018

Exploring Pennsylvania’s Gerrymandered Congressional Districts

by Daniel McGlone

Read post

07/19/2017

The Most Gerrymandered States Ranked by Efficiency Gap and Seat Advantage

by Daniel McGlone and Esther Needham

Read post

Press

We’ve also been featured in some great articles:

06/07/2017

The Mathematicians Who Want to Save Democracy

Scientific American

Read article

05/01/2018

Gerrymandering Is Out of Control

Reason

Read article

10/25/2012

Which States, Districts Are Most Gerrymandered?

Governing

Read article
Work with us

What you can do

We’ve built products, tools, and offer consulting based on our research into redistricting and gerrymandering.

Get expert support

Our research into redistricting, gerrymandering and expert witness testimony has made us a leader in political data analysis.

Let us help you with:

  • Redistricting plans and demographic analysis
  • Gerrymandering research and analysis
  • Expert witness testimony
Work with us
  • DistrictBuilder

    Enable public participation in redistricting

    We believe that enabling citizens to participate directly in the redistricting effort has the potential to transform the process. DistrictBuilder is a free, open source product that puts the power of drawing electoral maps in the hands of the people. Redistricting can be a transparent process that represents communities fairly and prevents gerrymandering.

    Try DistrictBuilder
    Screenshot of the new, free redistricting tool – DistrictBuilder.
  • Elected Officials and Districts tool

    Powered by Cicero

    Visualize your districts, current and new

    The Elected Officials and Districts tool allows people to explore the data for every legislative district at the National and State level in the U.S. (as well as 8 other countries) for over 350 cities and counties. Enter your address to find current elected officials and their contact information, or visualize your current and future legislative districts.

    Try the tool
    Screenshot of the Elected Officials and Districts tool in a laptop.

Contact us to learn more about our work around redistricting and gerrymandering.

Contact us